So, you manage a queue. You know your customers walk into your queue and they walk out. You also know your customers don’t navigate the queue seamlessly without at least a little effort on your part. But how do you know if your effort is paying off? The answer is simple. Monitor the customer flow within your queueing area. To effectively monitor customer flow, there are 4 metrics you should have at your fingertips at all times. With these factors known, you are better able to maximize efficiency, increase customer satisfaction, and improve productivity. Let’s take a closer look.
Customer Flow Metric #1: Queue Activity
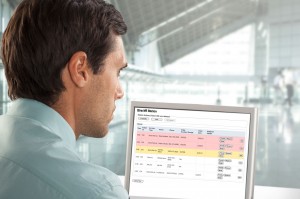
Monitoring queue activity includes taking into account all floor space within and around the queue and service area. Map out this activity to determine if waiting lines are deserted or if increasingly large crowds are starting to form in the queue. Also, look for evidence that some queues are receiving more activity than others. Unbalanced service areas simply promote inefficiency. To take full advantage of monitoring queue activity try implementing a system with real-time alerts. As a manager, you can instantly receive notifications when wait times, queue lengths, or other important KPIs are out of compliance. You gain control over your queues as you stop problems before they escalate.
Customer Flow Metric #2: Speed of Service
Gauging the overall speed of service in your queue is of multi-faceted importance. You have taken the time to carefully determine how many customers you need to put through your queue each day to keep your business running. You also know how long customers are willing to wait to be served before negative feelings and unwanted actions come to fruition. These factors determine your target range of acceptable service speeds. But how do you know if you are attaining the service speed goal? Track it of course. If you are informed, you can take action when discrepancies arise.
Customer Flow Metric #3: Customer Count
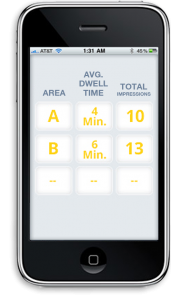
This metric sounds simple. Count people as they enter the queue and count people as they exit. The objective is to know the number of customers in your queue at all times. At any given point in time does this capacity number match what you were expecting? Is it more or less than what you are capable of handling?
Customer Flow Metric #4: Predicted Queue Backups
As you track metrics 1 through 3, you capture more than just the knowledge needed to solve present queueing problems, you create historical reports that will show you trends over time. These trends will let you accurately predict when queue backups are likely to occur taking your forecasts from guesswork to strategic plans. These plans include proactively managing staffing requirements, knowing when to open additional service stations or queues, and improving overall productivity by reducing the impact of queue backups before they start. Monitoring your customer flow ultimately leads to increased customer satisfaction. If you know what is going on in your queue, you can effectively communicate with your customers and manage their expectations. For example, knowing your customer count and service speed allows you to determine an estimated wait time. By broadcasting this wait time to waiting patrons, you help them become more satisfied with the wait at hand. Monitoring the queue also lets you take the steps necessary to streamline the overall queueing experience which is an obvious crowd-pleaser. Get in the know. Monitoring customer flow is key to maximum efficiency, customer satisfaction, and productivity. Do you know your metrics?